 See it live
VOLUME
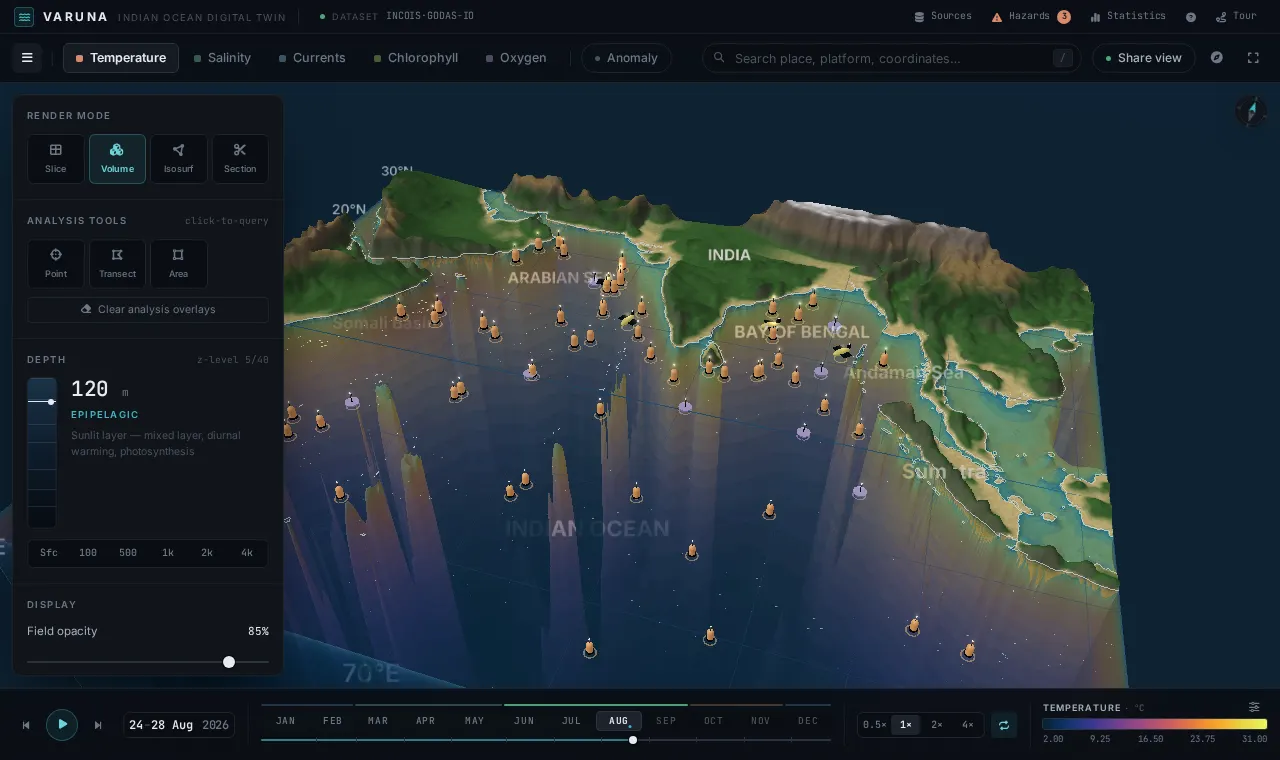
Volumetric rendering
The full 3D temperature, salinity or oxygen field as a translucent volume — thermocline, OMZ cores and eddies readable at a glance, evaluated per-pixel on the GPU.
Explore, understand and analyze the ocean in four dimensions — depth, space, time and data. Model forecasts fused with live Argo, glider and in-situ observations, rendered natively in your browser.
Every day, supercomputers, satellites and thousands of autonomous instruments generate terabytes of ocean data across depth, space, time and dozens of variables. Locked inside NetCDF files and specialist tools, it stays invisible to nearly everyone who needs it.
VARUNA makes that data visible — turning the four-dimensional state of the Indian Ocean into something you can see, move through and question directly.
A browser-native workspace where model fields and real observations share a single, navigable 4D scene. Try the controls below.
Sunlit surface — mixed layer, diurnal warming, photosynthesis
See it liveThe full 3D temperature, salinity or oxygen field as a translucent volume — thermocline, OMZ cores and eddies readable at a glance, evaluated per-pixel on the GPU.
 See it live
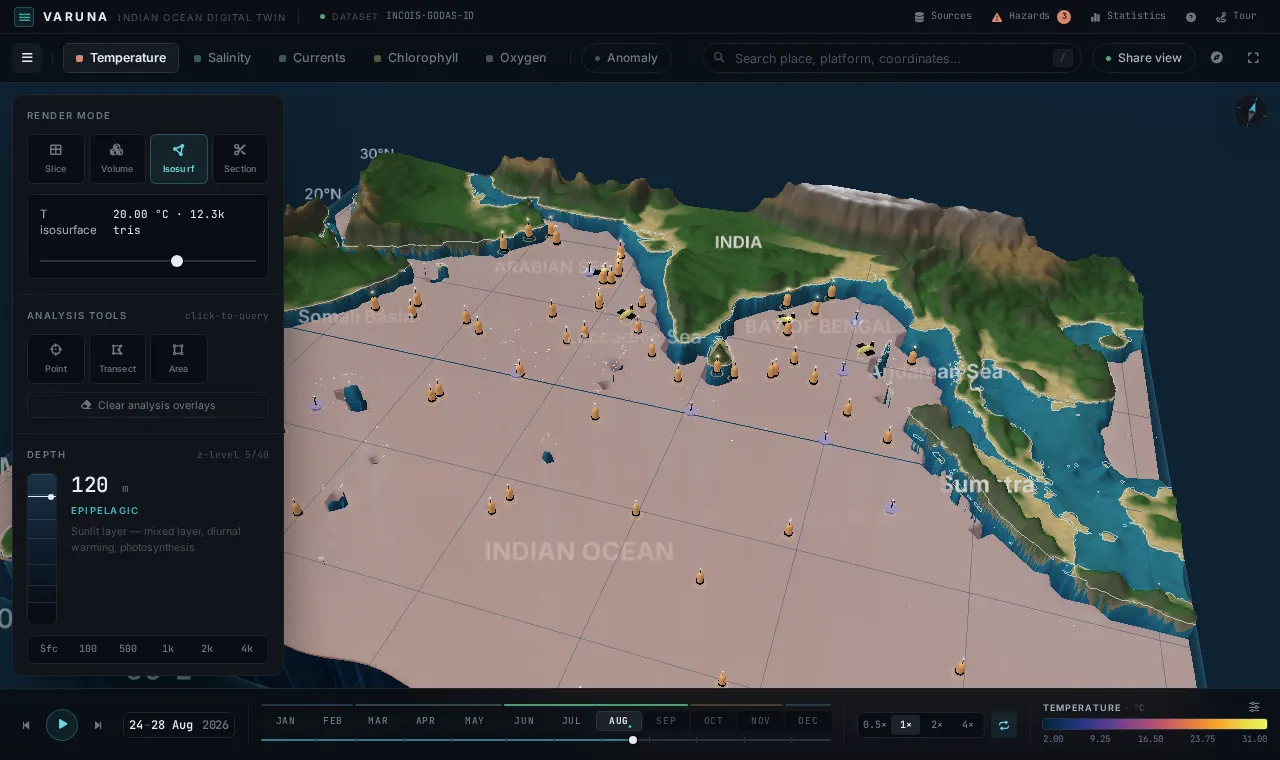
Sweep 40 stretched z-levels or extract the 20 °C isosurface live via marching cubes — the classic thermocline-topography proxy, reshaped as you scrub time.
 See it live
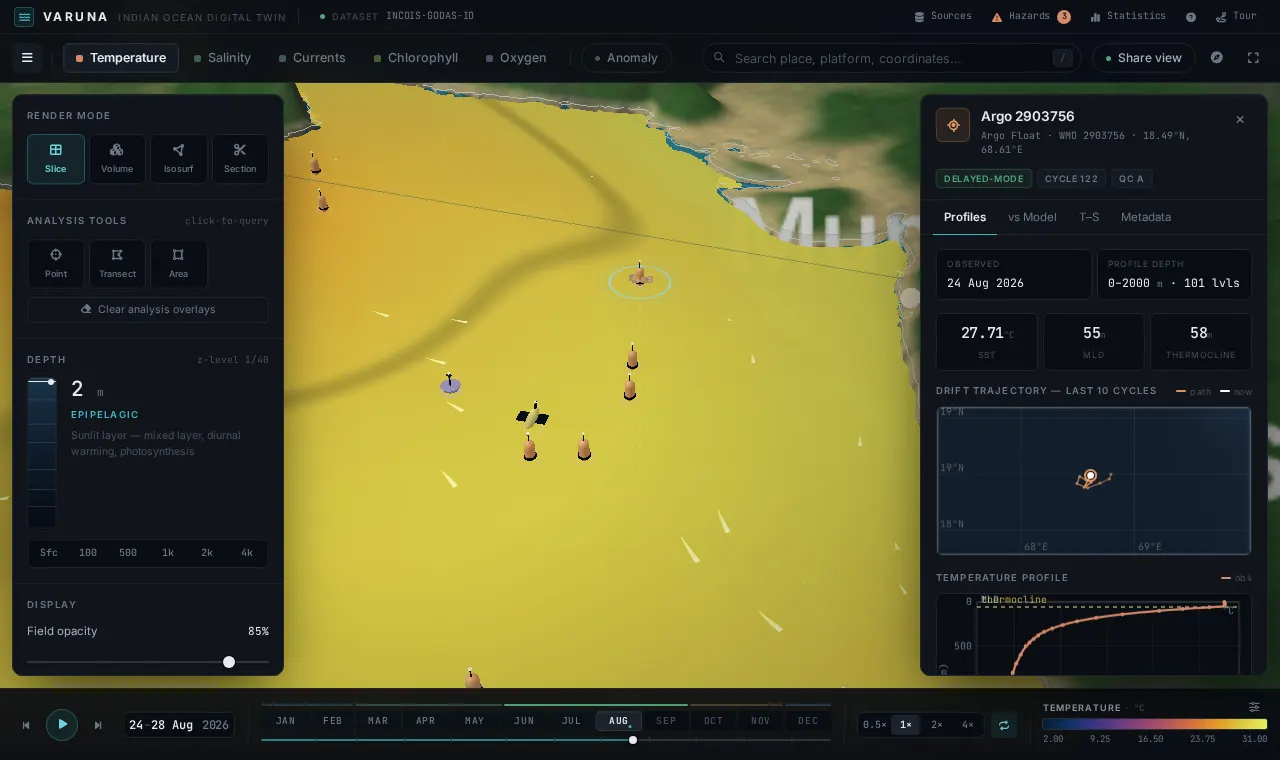
Click any platform for its T/S profile, drift track on real bathymetry, and an obs-vs-model misfit panel with RMSE and bias — validation forecasters currently assemble by hand.
 See it live
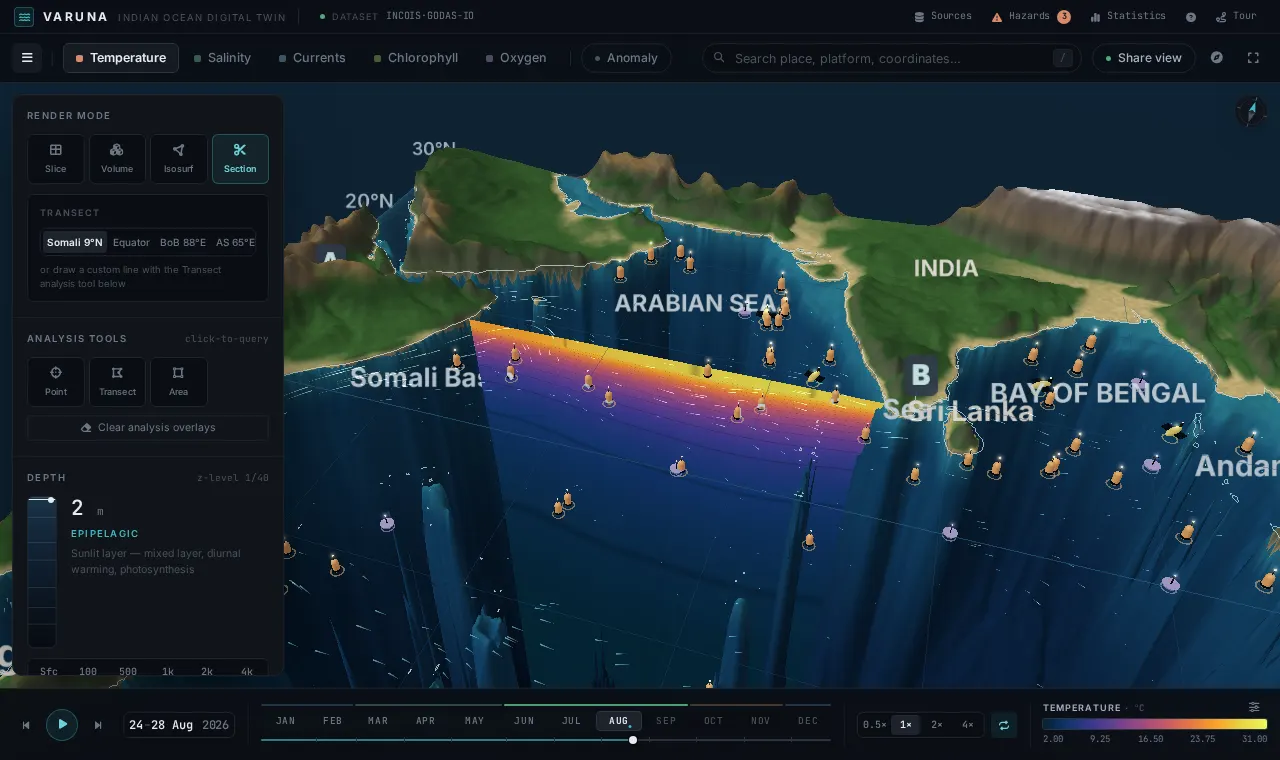
Draw any A→B line: a GPU curtain follows it in 3D while a 2D section chart tracks your hover. Drag a box for regional statistics, histograms and annual cycles. Everything exports to CSV.
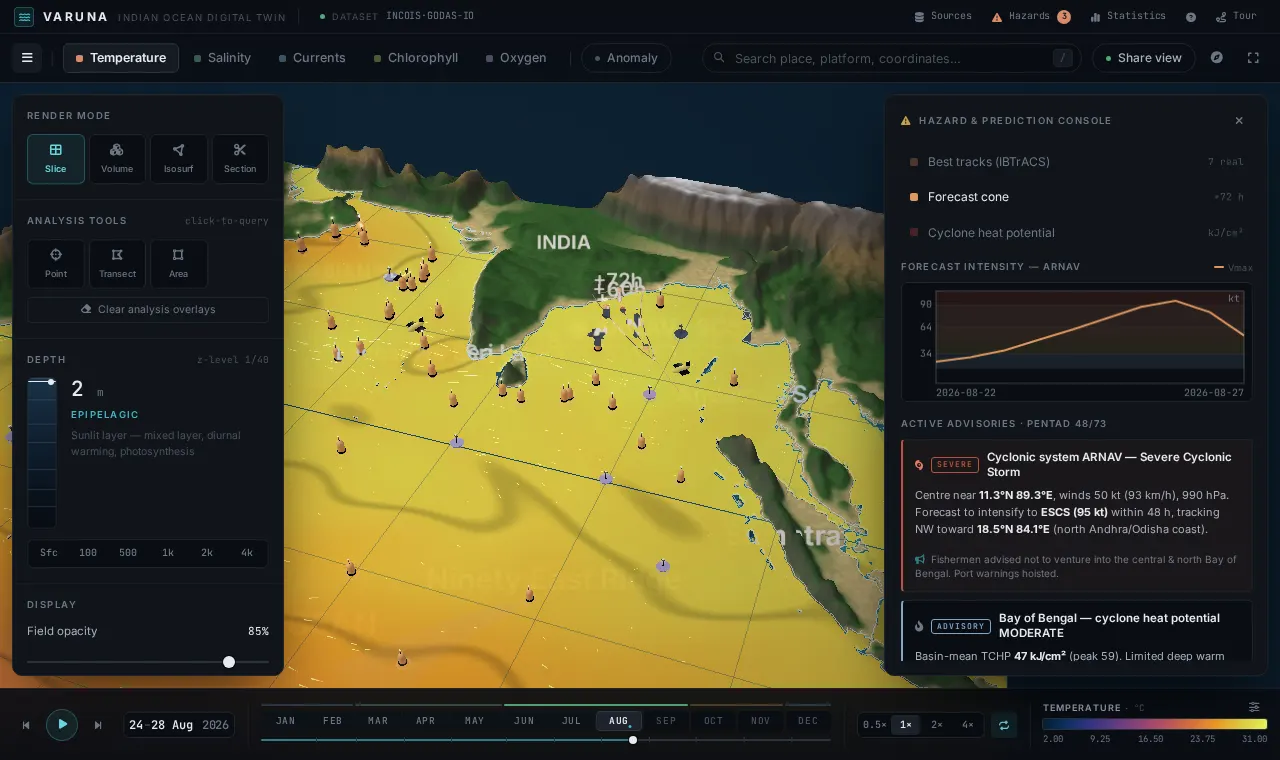 See it live
Seven real IBTrACS cyclone tracks in IMD category colors, a forecast cone demo, Tropical Cyclone Heat Potential overlay, and a five-type advisory engine for the current pentad.
Sunlit, wind-mixed, warm.
Scroll to descend. Temperature, salinity and currents transform continuously through the full water column.
Explore any variable through the full water column as a continuous, navigable volume.
Move vertically through 40 z-levels and inspect how conditions change with depth.
Render surfaces of constant value to reveal hidden thermal and density structures.
Visualize the three-dimensional movement of water with streamlines and particles.
Travel through ocean conditions across days, seasons and years of model output.
Drop real Argo, glider and CTD observations directly onto the model field.
Click any float or glider to inspect its vertical profile and full time history.
Tune ranges, opacity and scientific colormaps for precise visual analysis.
Track cyclone-driven ocean response and storm-surge precursors.
Forecast surface drift to focus operations on high-probability zones.
Deliver depth-resolved state estimates for shipping and offshore work.
Locate thermal fronts and productivity that concentrate marine life.
Watch heat content, anomalies and long-term basin-scale change.